performance

“Small Data” is Becoming a Potentially Bigger Problem

“There are three kinds of lies: lies, damned lies, and statistics.” – Unknown

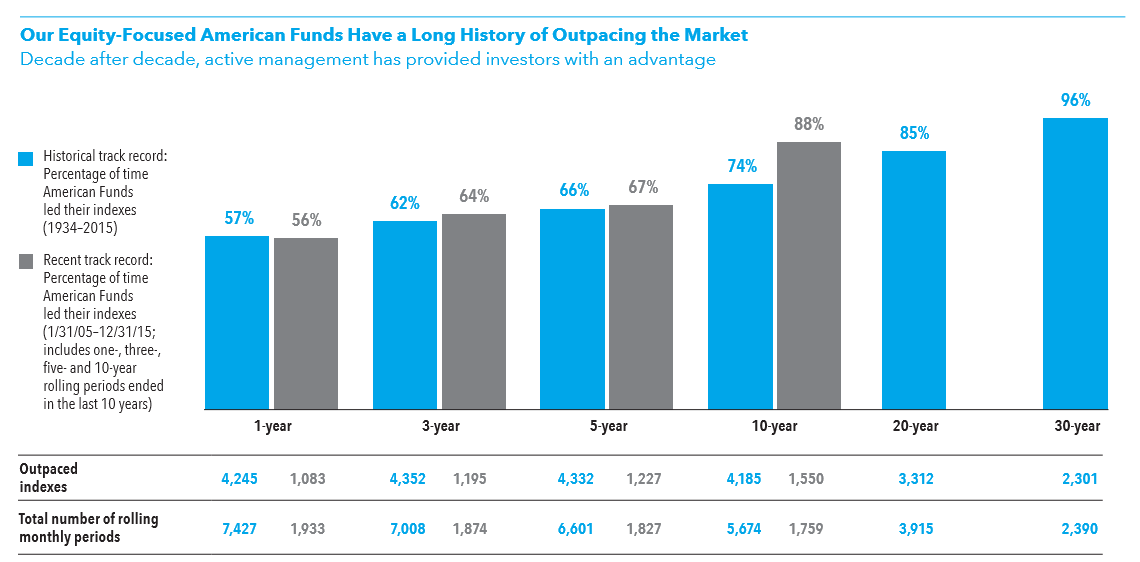
What do you see when you react to the following chart from American Funds?

american-funds-active-1

At first glance the title and bar charts do their jobs. The likely reaction from most readers is probably along the lines of it looks like the majority of American Funds’ mutual funds have done a good job beating their indexes. Point made.

But, someone (like me) might linger on the chart for a few extra seconds, leading some questions to come to mind:

  • What are “equity-focused” funds? Is the data set not just pure equity funds?
  • Is the data gross or net of fees? If gross, how does that impact the results?
  • Why is the “recent” track record defined as 10 years?

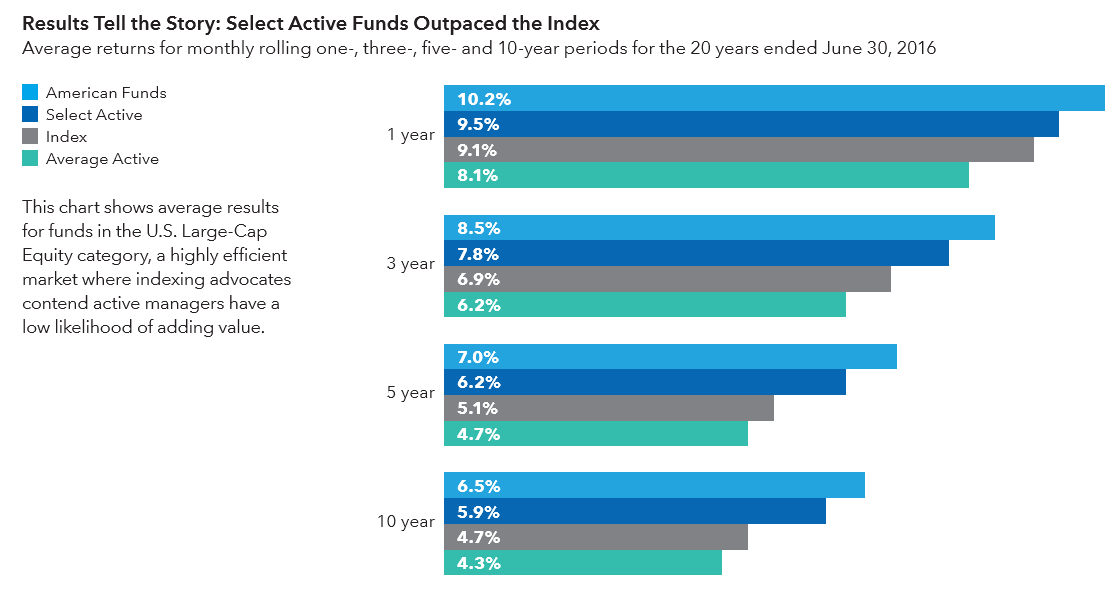
Here’s one more example that leads off a different American Funds piece supporting active management:

american-funds-active-2

Again, a cursory look gives a clear initial takeaway. A bit more consideration, however, can trigger a few more questions:

  • How were the specific thresholds for defining “Select Active” funds determined?
  • Is the data gross or net of fees? (Yes, this question is essentially ubiquitous.)
  • Why is only US Large Cap Equity included? How does the data vary for other categories?

These questions are the result of what I’ll call the industry’s “small data” issue. Small data is the information that asset managers use to support their ideas and research. It is the ever-present backbone of the countless arguments making the cases for asset classes, factors, specific mutual funds, and more.

The problem with small data is two-fold:

  1. The parameters and decision-making processes surrounding it are often unclear, even if someone willingly roots around the disclosures.
  2. There is no uniformity in the construction and use of small data between firms or even within a single firm.

Limited consistency and transparency on the context, definition, and presentation of small data can foster questions and skepticism. I (unscientifically) wonder if firms are unintentionally making it easier for people to doubt what they see or view such data as wholly self-serving, especially given people’s general distrust of marketing messages.

Despite the burden of disclosure, the use of small data makes me think firms might benefit from a more overt approach to communicating the context around the data they present. Clear, prominent, and consistent presentation of the key parameters and rationale for a data set may both reduce potential skepticism of that data and earn firms implicit credit for being up-front with clients.

Are the Barron’s Rankings Bad for Asset Managers?

Last week Barron’s published their annual fund family rankings. As they typically do, Barron’s focuses first and mostly on one-year results, noting that most of this year’s winners “rose from the very bottom of the 2011 list”.

Did they ever. Only one of the top 10 firms from last year remained in the top 10 this year. Putnam finished first a year after placing 57th.

Putnam touted their #1 ranking in Barron's on their Web site.

Putnam touted their #1 ranking in Barron’s on their Web site.

The Barron’s list gets a lot of attention and the winners tend to use the results as promotional fuel. But as I digested the results, I started to wonder if the Barron’s rankings do more harm than good for fund families.

The volatility of the list is one damaging aspect. Besides the short-term shuffling, this year saw 2011’s 10-year winner drop all the way to 15th in this year’s 10-year rankings.

I think it’s entirely plausible that these results can lead people to question if it’s possible for managers to have a sustainable advantage. At a time when actively-managed equity products in particular have hemorrhaged money, painting a picture of randomness is far from favorable.

The other problematic aspect of the rankings is the overwhelming emphasis placed on one-year results. Managers almost universally preach long-term thinking – that it is market cycles that matter, not days or weeks or months.

Yet, when given a chance to focus on positive one-year results, many of the firms embrace that opportunity to the fullest. Most of the top 10 have done something to trumpet the Barron’s list, something that I see as counter to a central tenet of their overall marketing and brand.

I’m not saying that firms shouldn’t be proud of good performance. But I think that to a certain degree it should be promoted in the consistent wrapper of long-term thinking and results.

David Swensen and the Reality of Past Performance

If you read our blog, by now you’ve probably also read David Swensen’s op-ed from the Saturday New York Times. There’s a lot in there worthy of discussion, but one paragraph in particular got a strong reaction from me:

Mutual fund companies, retail brokers and financial advisers aggressively market funds awarded four stars and five stars by Morningstar … But the rating system merely identifies funds that performed well in the past; it provides no help in finding future winners. Nevertheless, investors respond to industry come-ons and load up on the most “stellar” offerings.

Let’s all say it together: past performance is not predictive of future results. True in investing? Yes. In life? No.

The reason David Swensen gets to write an op-ed for the New York Times and lead the Yale endowment is because of what he’s done in the past. Looking at the track record of anything is the most intuitive evaluation barometer we have. Ignoring it is neither natural nor logical.

This doesn’t mean the issue Swensen raises – investors unsuccessfully chasing performance – isn’t real. I just think he’s angrily, unfairly, and incorrectly casting blanket blame on mutual fund marketers and financial advisors, who generally believe in what they’re doing and try to do right by their customers and themselves.

The real enemy here for Swensen is human nature. It’s in our nature to be emotional and overconfident, and compensating for these realities will require a lot more than broad-stroke, ham-handed criticisms of an entire industry.

Marketing Volatility – A Tendency to Oversimplify

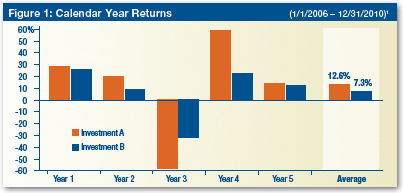
Take a look at the following chart:

It’s taken from a recent MainStay Investments piece on volatility. MainStay uses this chart and two others to point out why volatility (standard deviation) matters: despite a significantly higher average annual return (12.6% vs. 7.3%), Investment A underperforms the more-stable Investment B in terms of 5-year total return to the tune of about 9%.

The piece is solid overall. It’s both concise (1 page) and visual (graphics communicate the message). However, I think it also illustrates one of the pitfalls in talking about volatility: oversimplification.

In MainStay’s example, the more volatile product delivers lesser performance. Pointing out the potential pitfalls of looking at average annual returns is ok, but I don’t think a thoughtful investor/advisor is truly challenged by the conclusion here. They can get lower volatility and a better return with the same product. It’s a slam dunk.

But a simple, minor shift in the data creates a much different conversation. For example, what if the Year 3 return for Investment A was -53% (instead of -58%)? In this case, Investment A delivers excess total return of about 4% over the 5-year period, but with twice the volatility. Now we have an interesting discussion. Should people forgo the extra return for a smoother ride?

In these more complicated scenarios is where the illuminating conversations about volatility can be had. As firms continue to incorporate volatility into marketing messages, especially with alternatives, I suspect that the most successful ones will be those that most deeply explore the details of how volatility really matters.

More on volatility later this week…

Advisors are Less Willing to Compromise with Alternatives

Scott Welch of Fortigent recently wrote an interesting article (FundFire, subscription required) about how the mentality of high-net worth individuals has changed toward alternative investments.  The big takeaway is his belief that retail-oriented, liquid alternative products will take significant market share from traditional hedge funds and fund-of-funds.

Turning toward advisors’ dealings with clients, Scott says:

An important question advisors can ask high-net-worth clients is, What is an acceptable trade-off between performance, liquidity, leverage and transparency?

A good question, but I don’t think this is the precise question to ask for two reasons:

  1. Performance isn’t part of the tradeoff equation anymoreHedge funds underperformed the broader markets in 2010 and had a slow start to 2011.  The time of assumed outperformance of limited partnerships compared to more liquid vehicles is passing.
  2. Without home-run performance, the other variables become non-negotiables.  Lousy liquidity terms?  Poor transparency?  Advisors will just take a pass.

These points reinforce what Scott is getting at – alternative products in retail packaging have huge potential.  Advisors are not going to want to choose among performance, liquidity, leverage, and transparency.  They’re going to want it all.